Daily Commodity Wire · Week in Review
Crude oil up 10.5% and Silver down 6.3% on the week
Week ending Friday, October 16, 2026
Closing prices
| Market | Close | Week chg | Wk ago | Yr ago | 5-yr avg |
|---|---|---|---|---|---|
| Grains | |||||
| Corn $/bu | 4.74¼ | ▼ 5½¢ -1.1% | 4.79¾ | 4.22½ | 5.05 |
| Soybeans $/bu | 12.60½ | ▼ 31½¢ -2.4% | 12.92 | 10.19½ | 11.82 |
| Wheat $/bu | 6.59¾ | ▼ 11¼¢ -1.7% | 6.71 | 5.03¾ | 6.52 |
| KC wheat $/bu | 7.03¾ | ▼ 15½¢ -2.2% | 7.19¼ | 4.91½ | 6.90 |
| Livestock | |||||
| Live cattle $/cwt | 228.45 | ▲ $1.40 +0.6% | 227.05 | 240.25 | 177.24 |
| Feeder cattle $/cwt | 342.075 | ▲ $0.125 +0.0% | 341.95 | 371.95 | 239.96 |
| Lean hogs $/cwt | 66.875 | ▼ $0.95 -1.4% | 67.825 | 82.375 | 78.17 |
| Dairy | |||||
| Class III milk $/cwt | 17.35 | ▲ $1.25 +7.8% | 16.10 | 16.98 | 19.22 |
| Class IV milk $/cwt | 21.00 | ▲ $0.18 +0.9% | 20.82 | 14.15 | 19.72 |
| Cheese $/lb | 1.625 | ▲ $0.12 +8.0% | 1.505 | 1.744 | 1.928 |
| Butter ¢/lb | 142.00 | ▲ 10¢ +7.6% | 132.00 | 171.60 | 2.541 |
| Energy | |||||
| Crude oil $/bbl | 101.46 | ▲ $9.61 +10.5% | 91.85 | 57.54 | 76.52 |
| Heating oil $/gal | 4.9029 | ▲ 16.45¢ +3.5% | 4.7384 | 2.1800 | 2.8420 |
| Natural gas $/MMBtu | 3.120 | ▼ $0.10 -3.1% | 3.220 | 3.008 | 3.969 |
| Metals | |||||
| Gold $/oz | 4,189.60 | ▼ $26.70 -0.6% | 4,216.30 | 4,213.30 | 2,457.76 |
| Silver $/oz | 57.175 | ▼ $3.875 -6.3% | 61.05 | 49.865 | 29.26 |
| Copper $/lb | 6.5705 | ▼ 12.15¢ -1.8% | 6.6920 | 4.9315 | 4.1966 |
Price charts
Last 6 months. ▬ This year ▬ A year ago - - 5-year average
Corn $/bu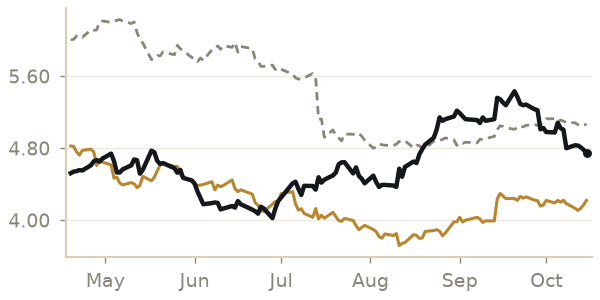 | Soybeans $/bu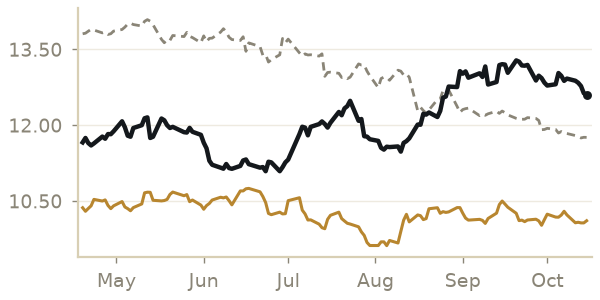 |
Wheat $/bu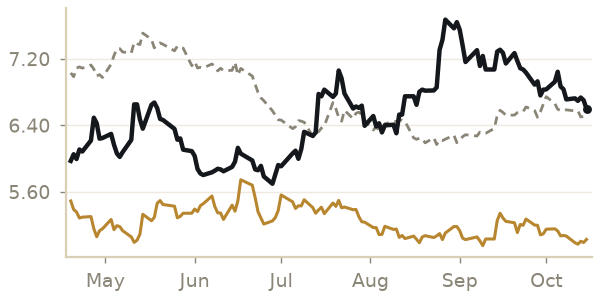 | KC wheat $/bu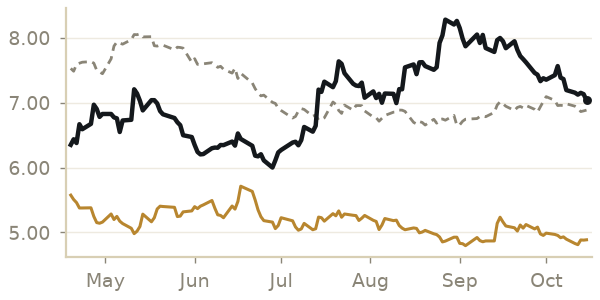 |
Live cattle $/cwt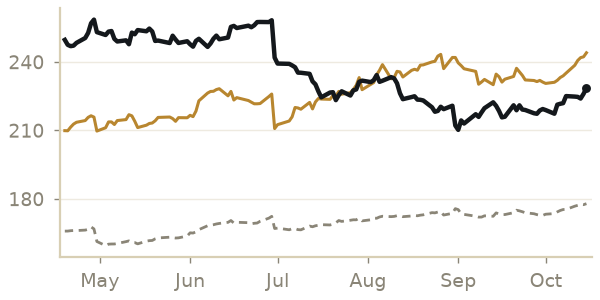 | Feeder cattle $/cwt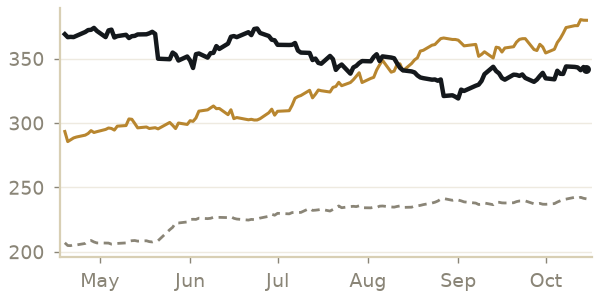 |
Lean hogs $/cwt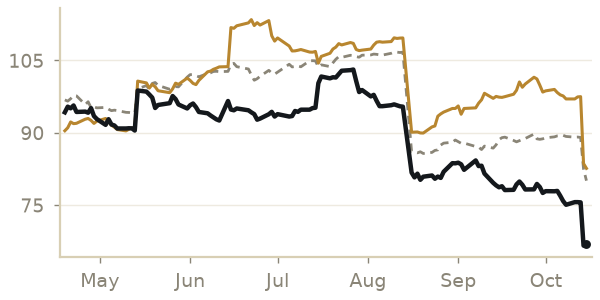 | Class III milk $/cwt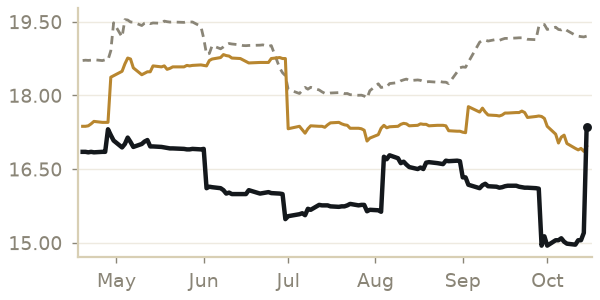 |
Class IV milk $/cwt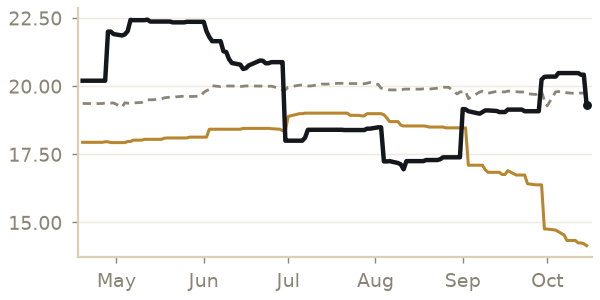 | Cheese $/lb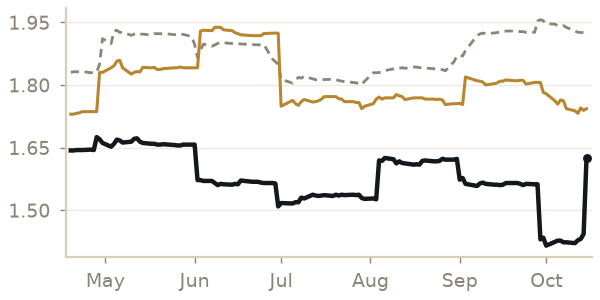 |
Butter ¢/lb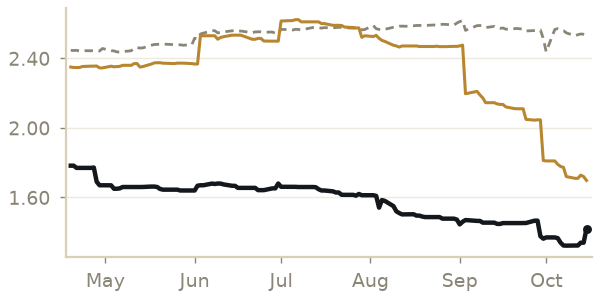 | Crude oil $/bbl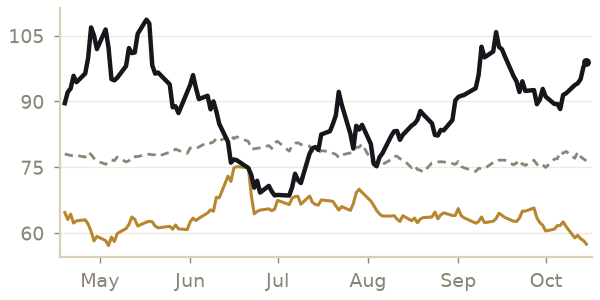 |
Heating oil $/gal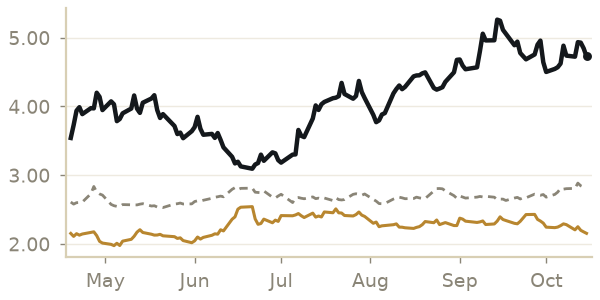 | Natural gas $/MMBtu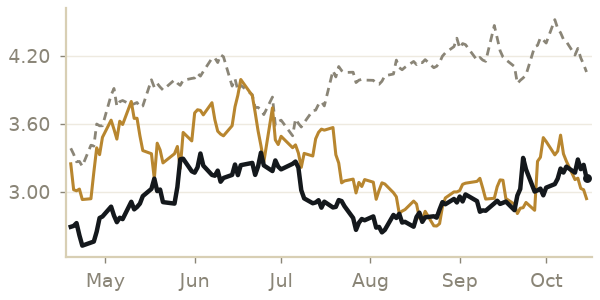 |
Gold $/oz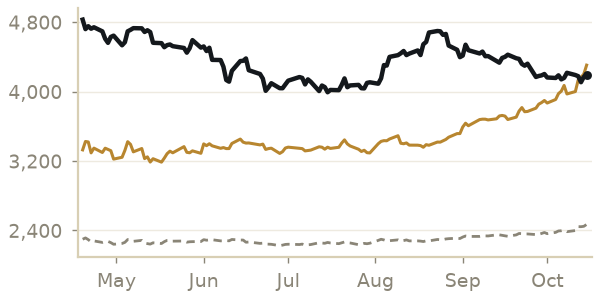 | Silver $/oz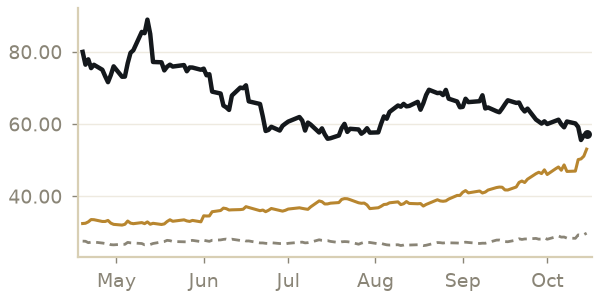 |
Copper $/lb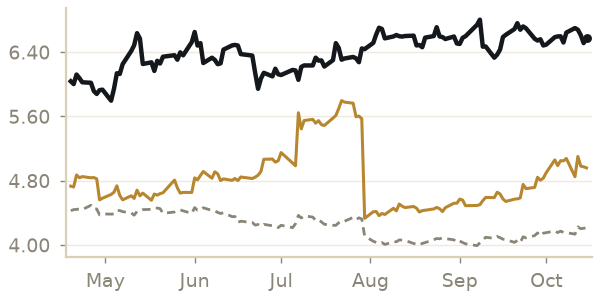 |
What moved the markets
Corn. Fri U.S. Soybean Prices Hit Seven-Week Low Despite China's Renewed Grain Purchases. Soybeans (-0.53%) and wheat (-1.64%) were lower too, so the selling was across the grain market. It's trading near the low of the day.
Soybeans. Thu CBOT Soybean Oil Futures Fall on EPA RIN Reallocation Uncertainty, Harvest Pressure - News and Statistics. Corn (-0.52%) and wheat (-0.59%) were lower too, so the selling was across the grain market. It settled near the low of the day.
Wheat. Fri Wheat Market Update: Black Sea Disruptions vs. Weak Demand. Corn (-0.84%) was lower too, so the selling was across the grain market. It's trading near the low of the day.
Live cattle. Thu ICE to launch cattle and hog futures in challenge to CME. Feeder cattle (+1.06%) and hogs (+0.83%) were higher too, so the buying was across the livestock market.
Feeder cattle. Thu ICE to launch cattle and hog futures in challenge to CME. Live cattle (+0.92%) were higher too, so the buying was across the livestock market. Corn was down 0.52%, which lowers feed costs for feeder buyers. It settled near the high of the day.
Lean hogs. Wed Livestock futures edge lower as Lean Hog net short nears record. Live cattle (-0.54%) were lower too, so the selling was across the livestock market. It settled near the low of the day.
Crude oil. Fri Oil Futures Rise on Middle East, Russia-Ukraine Concerns. Diesel (+1.24%) was higher too, so the buying was across the energy market. It settled near the high of the day.
Heating oil. Tue Heating Oil Surges Nearly 5%. Crude oil (+0.48%) was higher too, so the buying was across the energy market. It settled near the high of the day.
Natural gas. Tue Natural Gas Prices Gain 6.1% in a Week: 3 Stocks to Watch. It settled near the high of the day.
Gold. Thu International Gold Prices Rebound in a Day After Shrugging Off US Inflation Shock — Dollar Weakness and Fed Caution Provide Support. Silver (+2.48%) was higher too, so the buying was across the metals market. It settled near the high of the day.
Silver. Wed Gold And Silver Tumble As Inflation Data Boosts Rate-Hike Expectations. Gold (-1.47%) was lower too, so the selling was across the metals market. It settled near the low of the day.
Copper. Wed Copper Prices Break 110,000, Operating Rate Drops to 11.55%: Peak-Season Stockpiling Falls Through Amid Dual Squeeze from Invoices and High Prices [SMM Analysis]. It settled near the low of the day.
Supply and demand (USDA WASDE)
| Crop | Yield | Ending stocks | Stocks/use | Farm price |
|---|---|---|---|---|
| Corn 2026/27 | 181.2 +2.7 m/m | 1,849 +282 m/m | 11.3% +1.6 m/m | $4.70 -0.10 m/m |
| Soybeans 2026/27 | 53.1 +0.3 m/m | 315 +5 m/m | 6.9% +0.1 m/m | $12.00 |
| Wheat 2026/27 | 48.1 +0.3 m/m | 740 +23 m/m | 39.8% +1.5 m/m | $6.30 -0.10 m/m |
USDA's October report; ending stocks in million bushels; change vs the month before. The whole report, explained
What the big funds hold
| Market | Net position | Week chg | vs 3 yrs |
|---|---|---|---|
| Corn | 329,839 long | -51,381 | near 3-yr high |
| Soybeans | 258,066 long | +11,508 | near 3-yr high |
| Wheat | 28,830 short | -6,721 | 83th pct |
| KC wheat | 23,253 long | -7,424 | 88th pct |
| Live cattle | 50,695 long | -2,498 | 20th pct |
| Feeder cattle | 9,386 long | +1,220 | 39th pct |
| Lean hogs | 41,504 short | +9,131 | near 3-yr low |
| Crude oil | 53,598 long | -25,994 | 17th pct |
| Heating oil | 11,427 long | -1,518 | 50th pct |
| Natural gas | 144,537 short | -11,738 | near 3-yr low |
| Gold | 110,987 long | -9,331 | 32th pct |
| Silver | 7,528 long | -86 | near 3-yr low |
| Copper | 61,134 long | -16,924 | 77th pct |
Managed money net futures and options position in contracts, CFTC Commitments of Traders as of Tuesday, Oct 6 (released Fridays). "vs 3 yrs" shows where today's position ranks against the last three years (near the top = funds hold about as big a long position as they have in 3 years).
Export shipments
- Corn: Shipped 51.3 million bushels (1.30 million metric tons) in the week ending Oct 8, down 7% from the week before. Marketing year to date: 333 million bushels, 5% ahead of last year's pace.
- Soybeans: Shipped 40.3 million bushels (1.10 million metric tons) in the week ending Oct 8, down 9% from the week before. Marketing year to date: 189 million bushels, 27% ahead of last year's pace.
- Wheat: Shipped 11.2 million bushels (0.30 million metric tons) in the week ending Oct 8, up 1% from the week before. Marketing year to date: 256 million bushels, 35% behind last year's pace.
Weather and drought
54% of the lower 48 is in drought, down from 55% last week and 46% a year ago.
Corn Belt in drought: IA 0%, IL 21%, NE 44%, MN 63%, IN 0%.
Rain, days 8-14 (green = wetter than normal)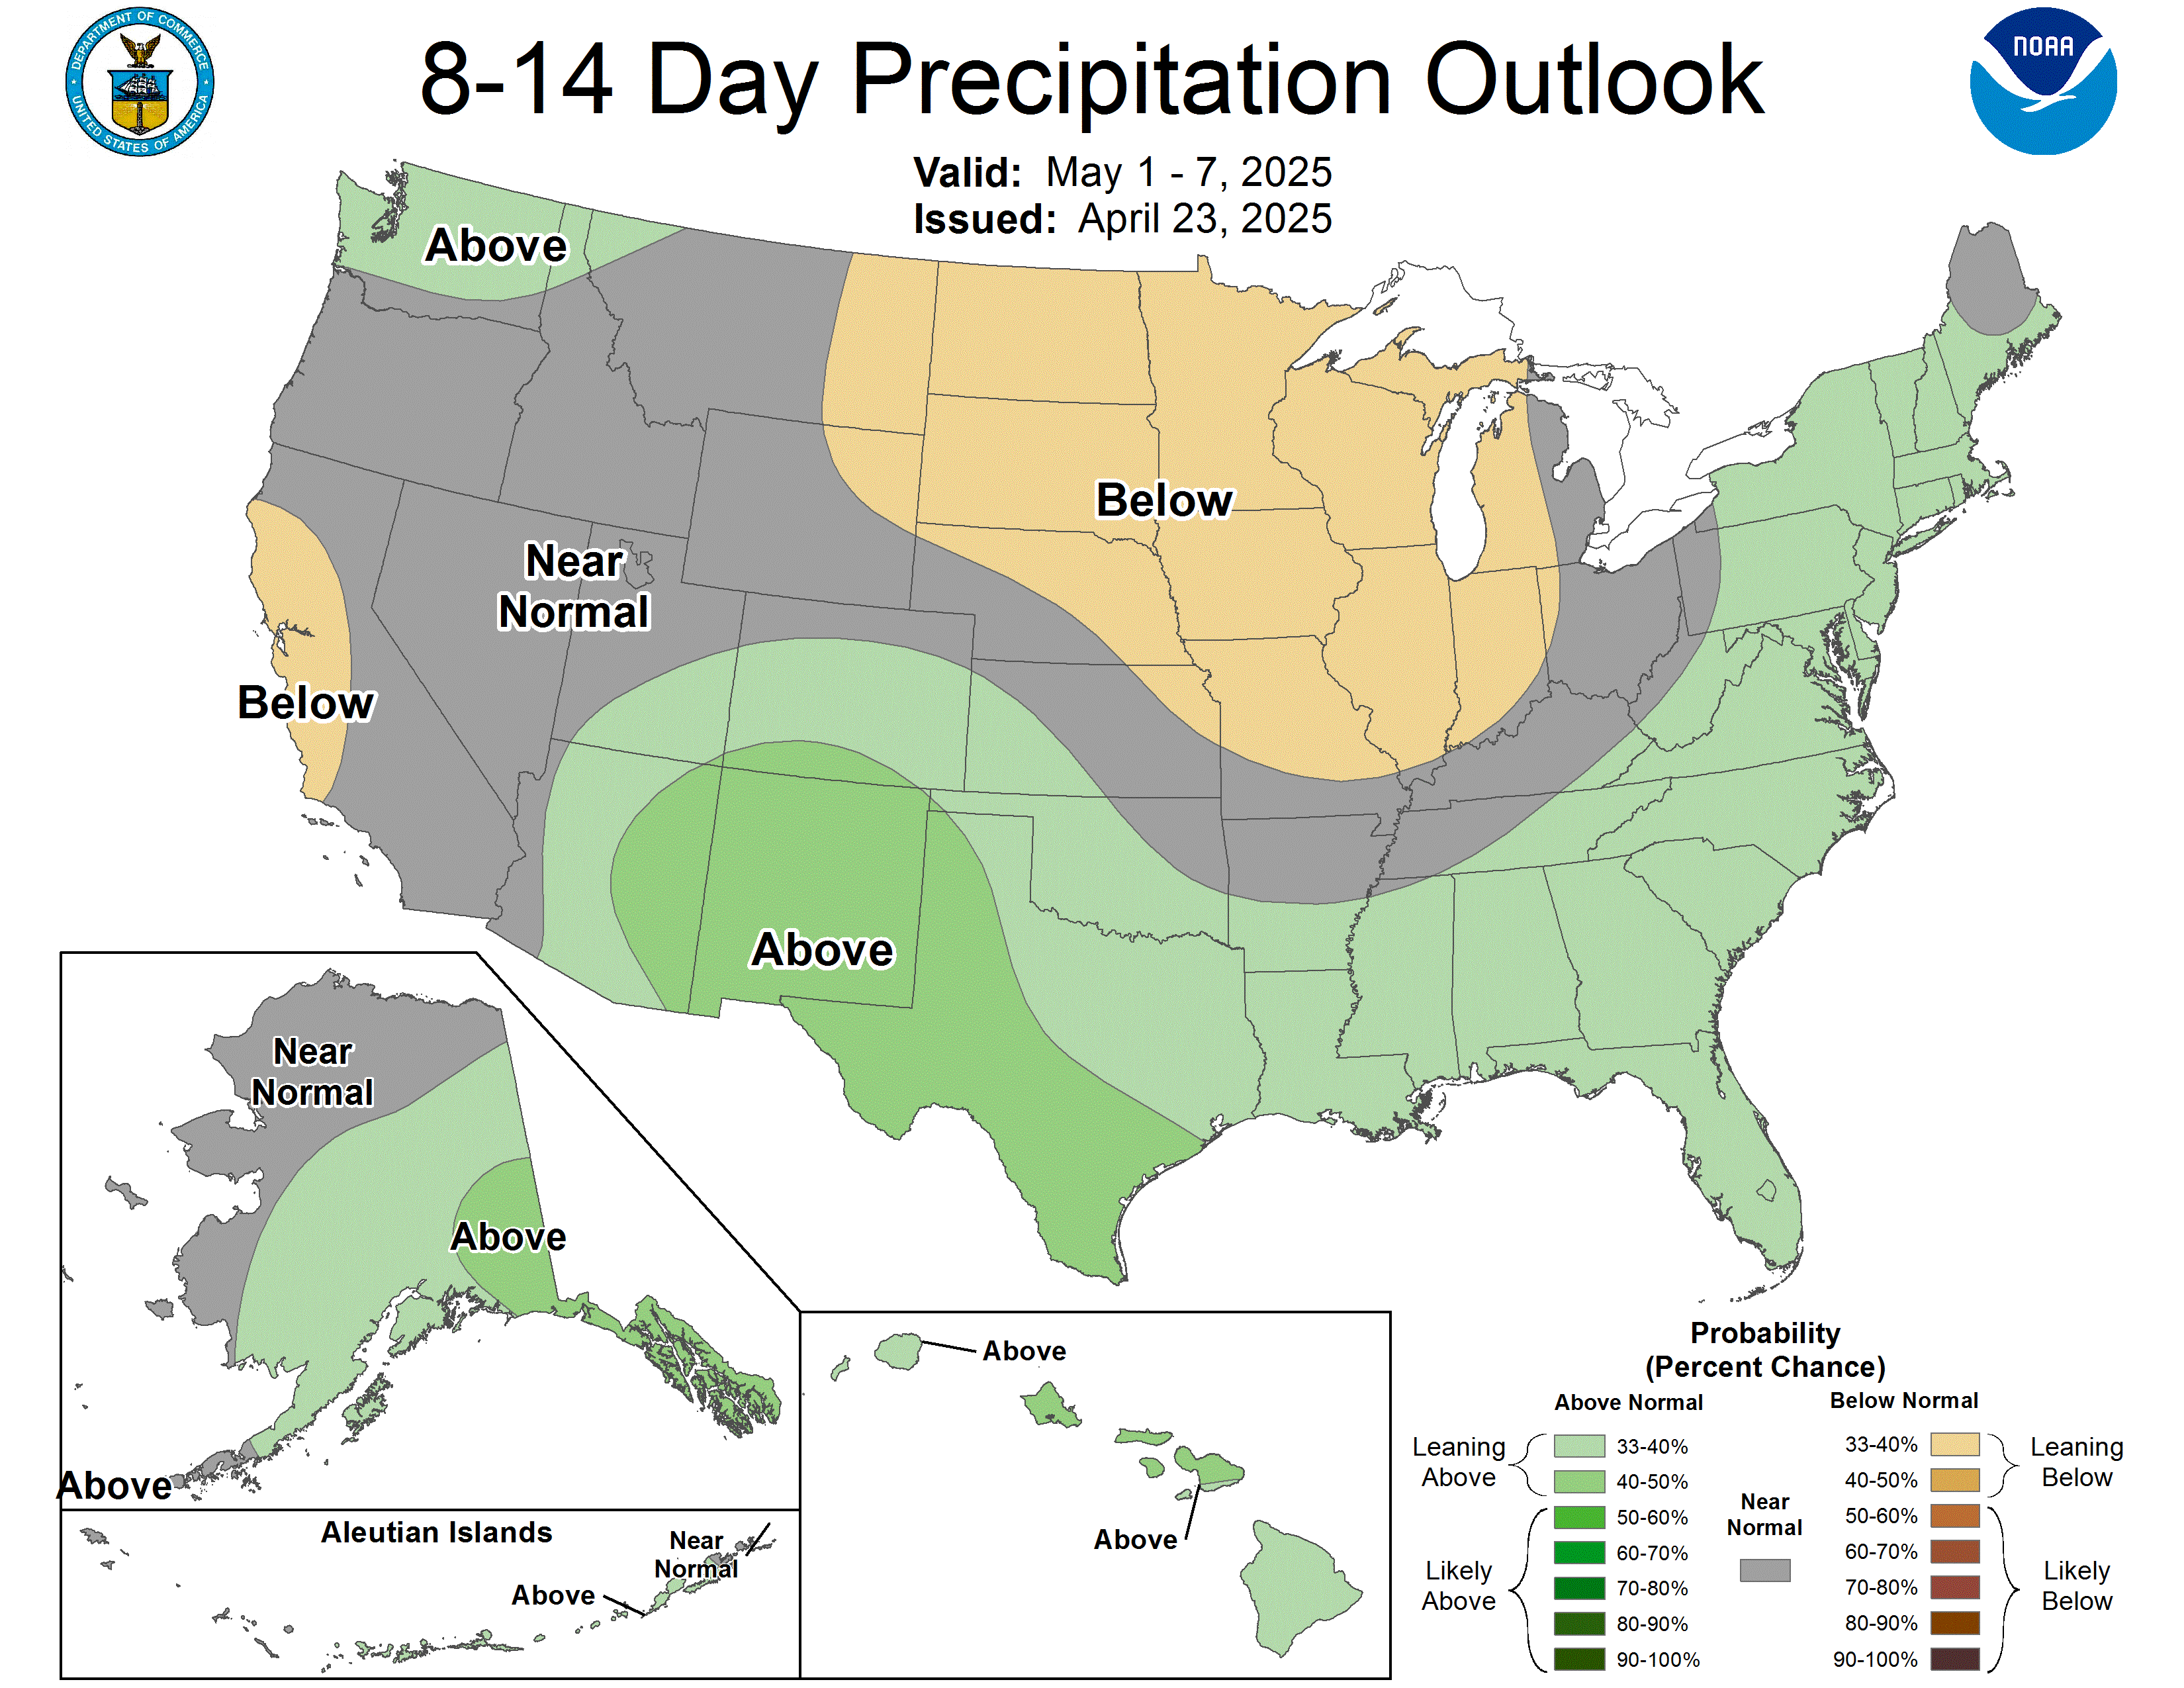 | Temperature, days 8-14 (red = warmer than normal)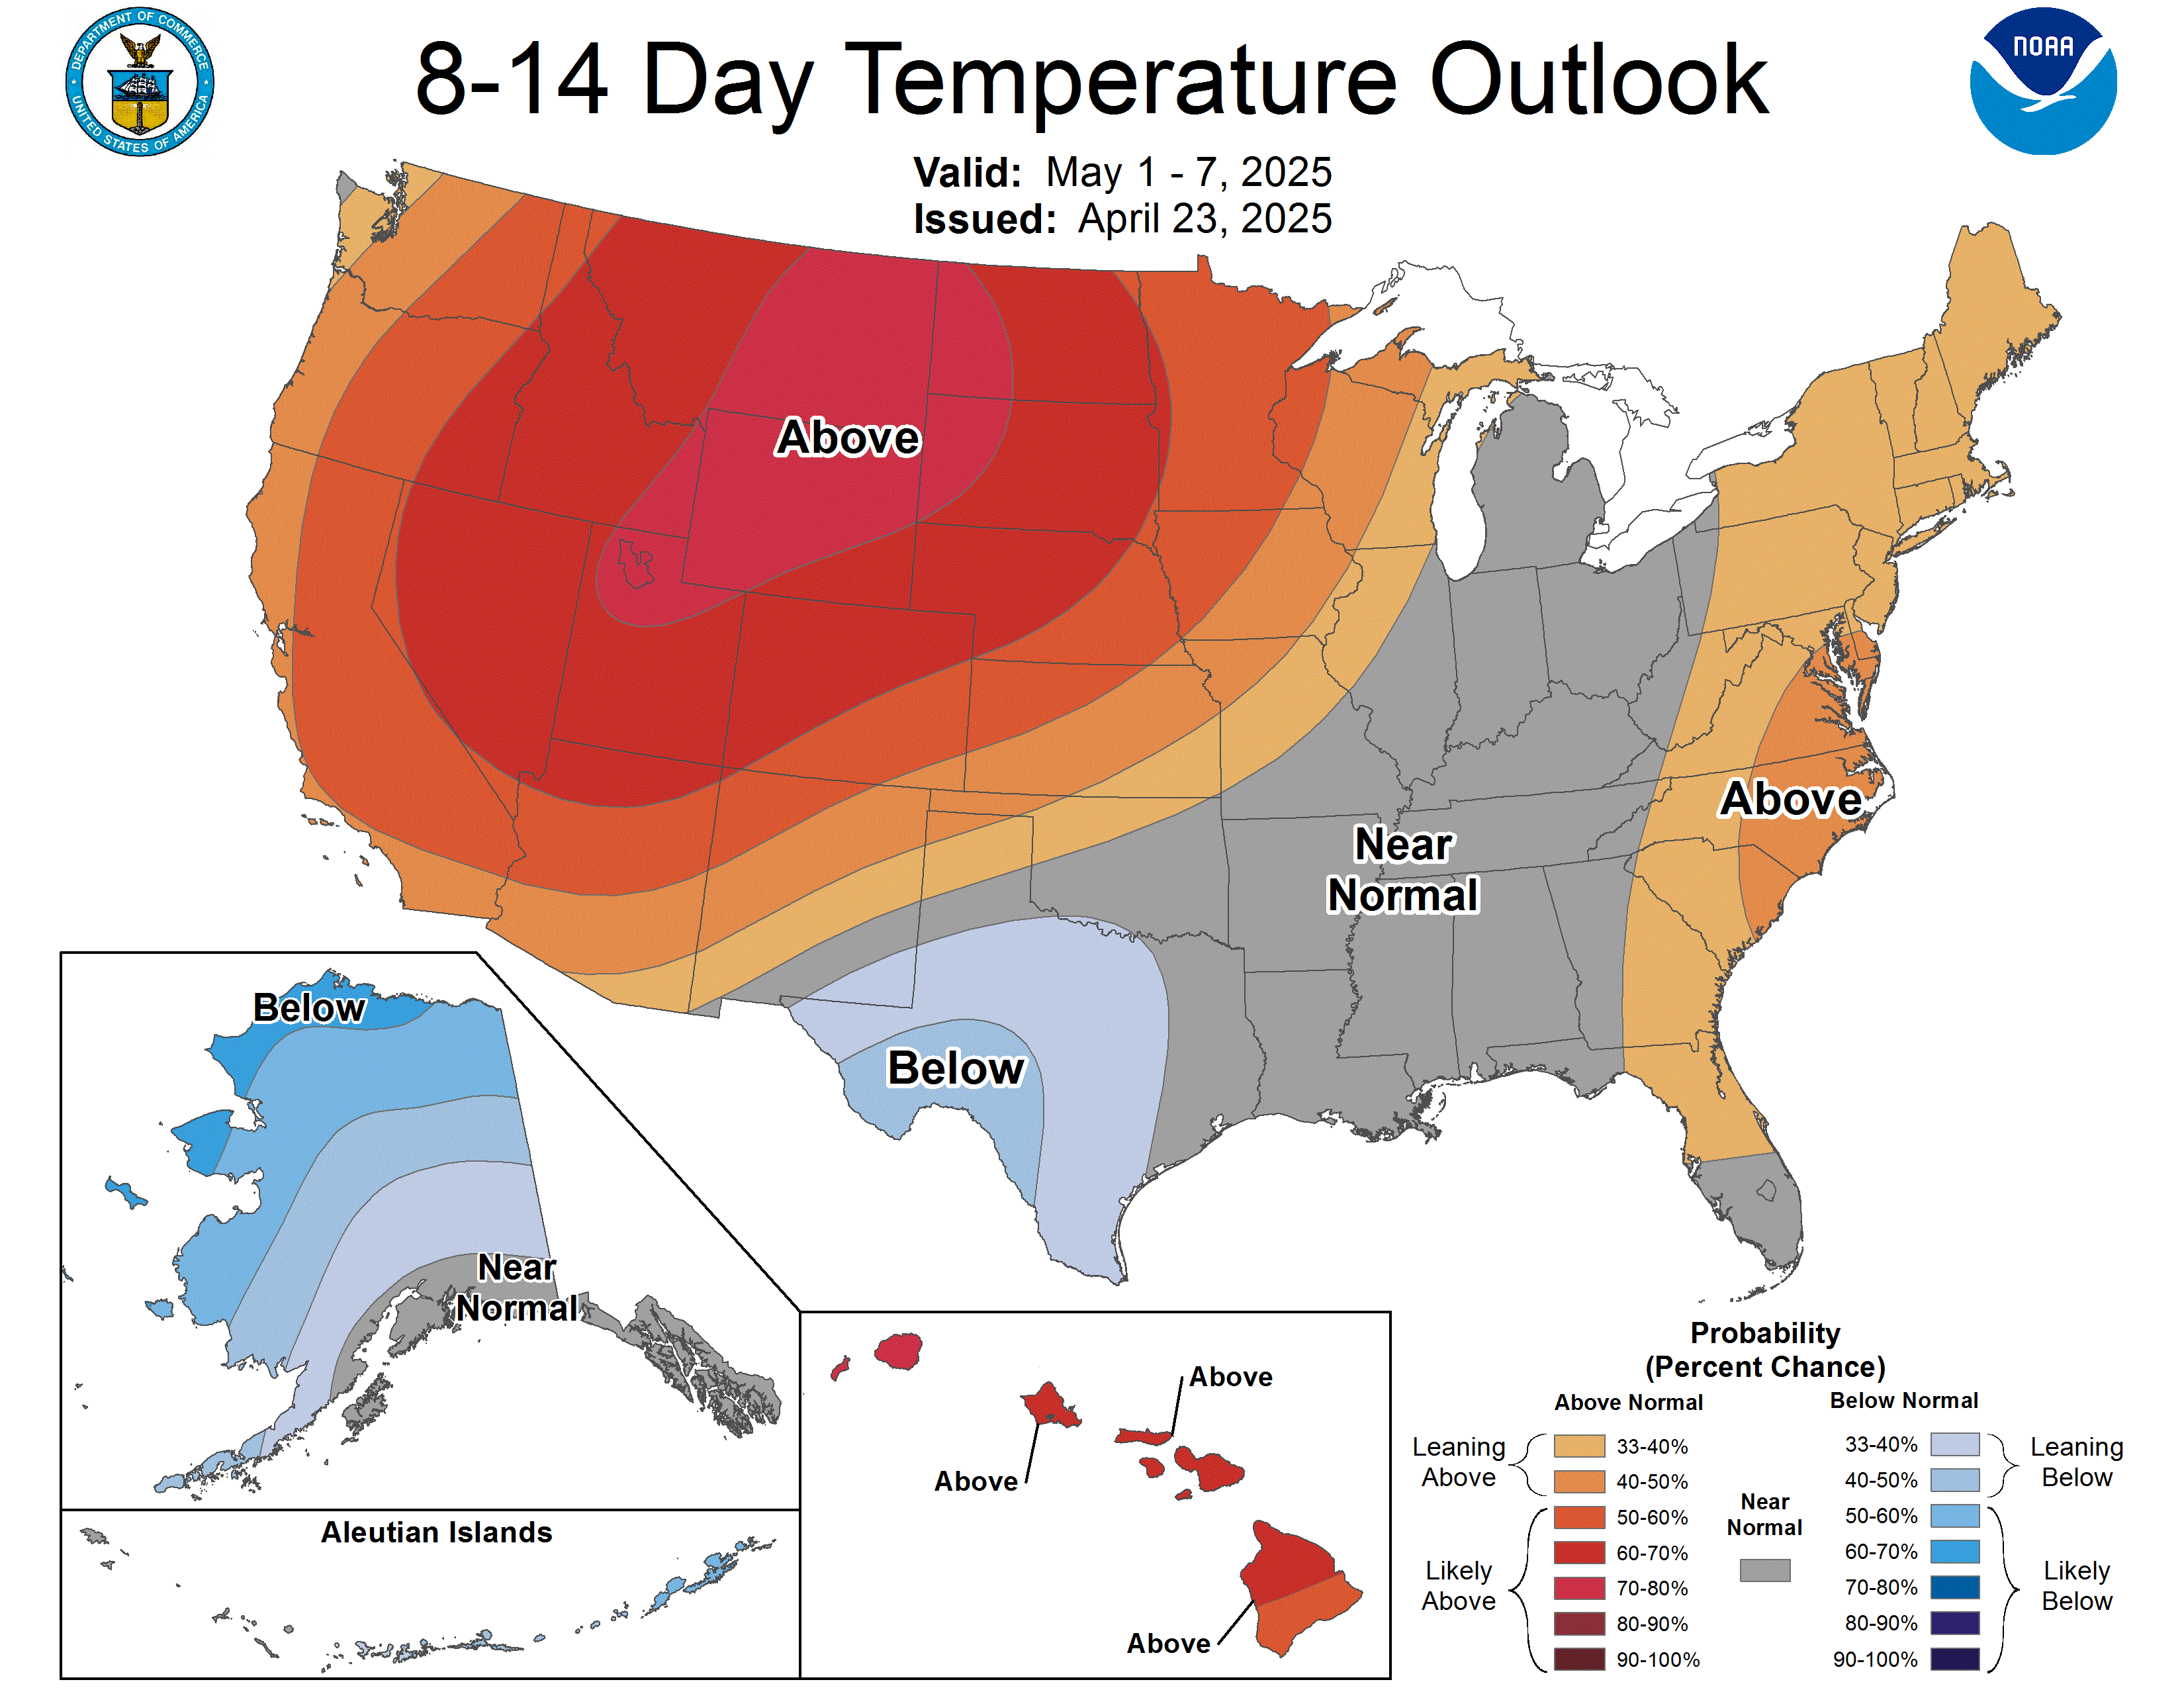 |
Maps: NOAA Climate Prediction Center. Drought: U.S. Drought Monitor. Forecast for your ZIP and drought by state
Reports that came out this week
- Tuesday: USDA export inspections; USDA Crop Progress
- Wednesday: Consumer prices (CPI)
- Thursday: Producer prices (PPI); U.S. Drought Monitor; USDA grain transportation data (barge, rail, ocean)
Bigger charts, up to 10 years, for every market: dailycommoditywire.com/markets
Next week's reports
- Monday: USDA export inspections (10:00am CT); USDA Crop Progress (3:00pm CT)
- Wednesday: EIA crude oil inventories (9:30am CT)
- Thursday: U.S. Drought Monitor (7:30am CT); USDA weekly Export Sales (7:30am CT); EIA natural gas storage (9:30am CT); USDA grain transportation data (barge, rail, ocean) (12:00pm CT)
- Friday: Cattle on Feed (2:00pm CT); USDA Cold Storage (2:00pm CT)
Prices: Yahoo Finance futures data, delayed. Reports: USDA, EIA, CFTC, NOAA. Informational only — not investment, trading or financial advice.
Get these free, every weekday at 10 and 2.
Subscribe free